ArcGIS Insights combines data visualization and analysis to accelerate decision making. From interactive charts and maps to advanced analytics, Insights offers a wide array of capabilities to help you understand your data, answer important questions, and create interactive reports.
The Insights 2022.3 release (November 2022) includes map labels, layer effects, and updates to data engineering. Keep reading to learn more about these new features so you can try them out the next time you use Insights.
Map labels
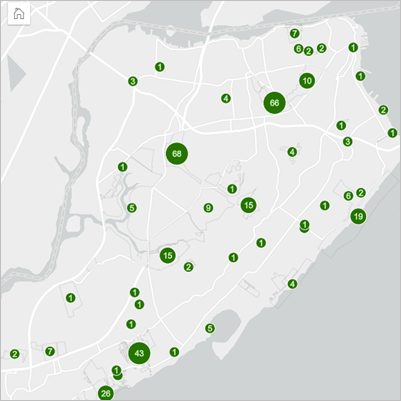
Labels can now be added for features on maps using Single symbol, Unique values, Counts and amounts (size), or Counts and amounts (color). Labels can be configured to change the font, placement, visible range, and halo effect. Overlapping labels can also be removed to reduce clutter on maps with dense or small features.

Layer effects
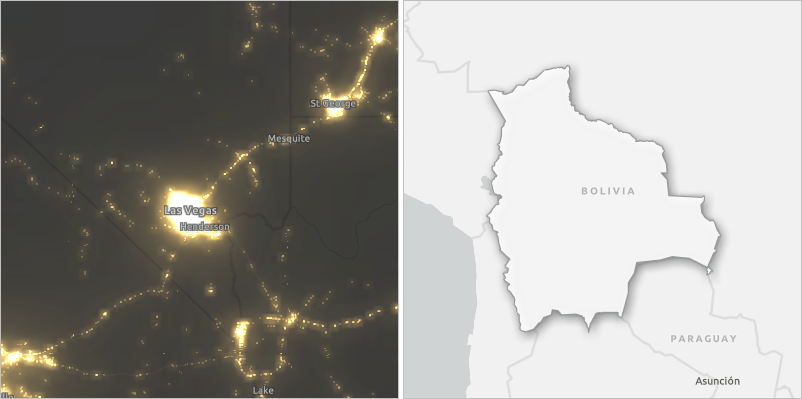
Bloom and drop shadow effects are now supported for all map types except link maps. Layer effects are used to create eye-catching maps and draw attention to specific features. Bloom and drop shadow effects include preset configurations plus options to customize the effects.

Data engineering
The second preview release of data engineering includes enable location by coordinates and address, the ability to refresh datasets in a data model, and changes to the interface for dataset tools.
To see an example workflow using data engineering in Insights, watch this video:
Other updates
- Map cards now support locking navigation to prevent zooming and panning.
- Data bar conditional formatting on reference tables now support rate/ratio fields.
- Line graphs and time series graphs with subgroups now support updating the line pattern for an individual line. Learn more about line graph and time series enhancements
More resources
You can now access these and several other enhancements in ArcGIS Insights. For a full list of new features, visit What’s new in the Insights help documentation.
We love hearing from you! Visit Esri Community to ask questions, access resources, and submit ideas for new features you want to see in Insights.


Article Discussion: