The December 2021 release of ArcGIS Dashboards includes some new and fun enhancements just in time to end the year. When you open Dashboards next, you’ll be greeted with a new user interface that makes managing your dashboard layout more efficient. As you author your dashboards, check out some of the new features that have been added, including the addition of tables and improvements to chart actions.
New authoring experience
When you open ArcGIS Dashboards to create a new dashboard or edit your existing ones, you will notice the user interface looks a bit different. You can now find your dashboard’s authoring tools, including dashboard settings, subscriber content, and save options, on the side toolbar.

Additionally, new to the toolbar is the Layout panel. The layout panel allows you to view and manage your dashboard’s layout more easily. In the panel, you can see all your existing elements and add new ones. You can also quickly see and switch between your dashboard’s body, header, and sidebar to add the elements and selectors that go in each one.
Get to know the new dashboard authoring experience.
Table
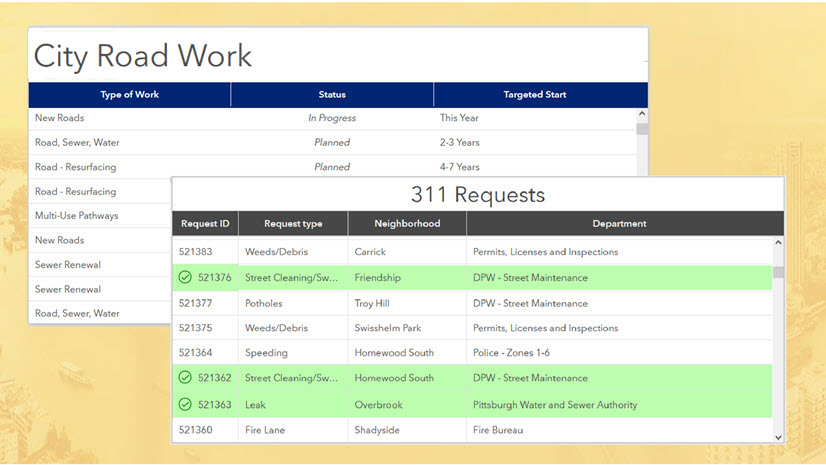
A new addition to dashboard elements, the Table element lets you visualize and present your data in a more granular way. You can now create tables to provide more depth and understanding to your dashboard’s data and do things like:
- Quickly scan precise values of key attributes
- Compare a metric across categories
- Summarize a collection of metrics

Table fully supports the use of Arcade for advanced formatting and since it’s a data-driven element, supports the use of Arcade data expressions as a data source. Additionally, tables can take full advantage of dashboard interactivity – they can be both the source and target for actions, and can allow for data download.
Learn more about tables and see the different ways they can be configured.
Chart actions
Actions for serial charts, pie charts, and tables have been improved with this release. You can now target elements based on different data sources with these elements. When the source and target elements are based on different data sources, you can establish the relationship between them with an attribute relationship.

All these latest enhancements are all now available in ArcGIS Dashboards. Create your first dashboard or open your existing dashboards to start using them! As always, we love seeing the dashboards you make. Share them with us on Twitter and LinkedIn using #ArcGISDashboards.


Article Discussion: