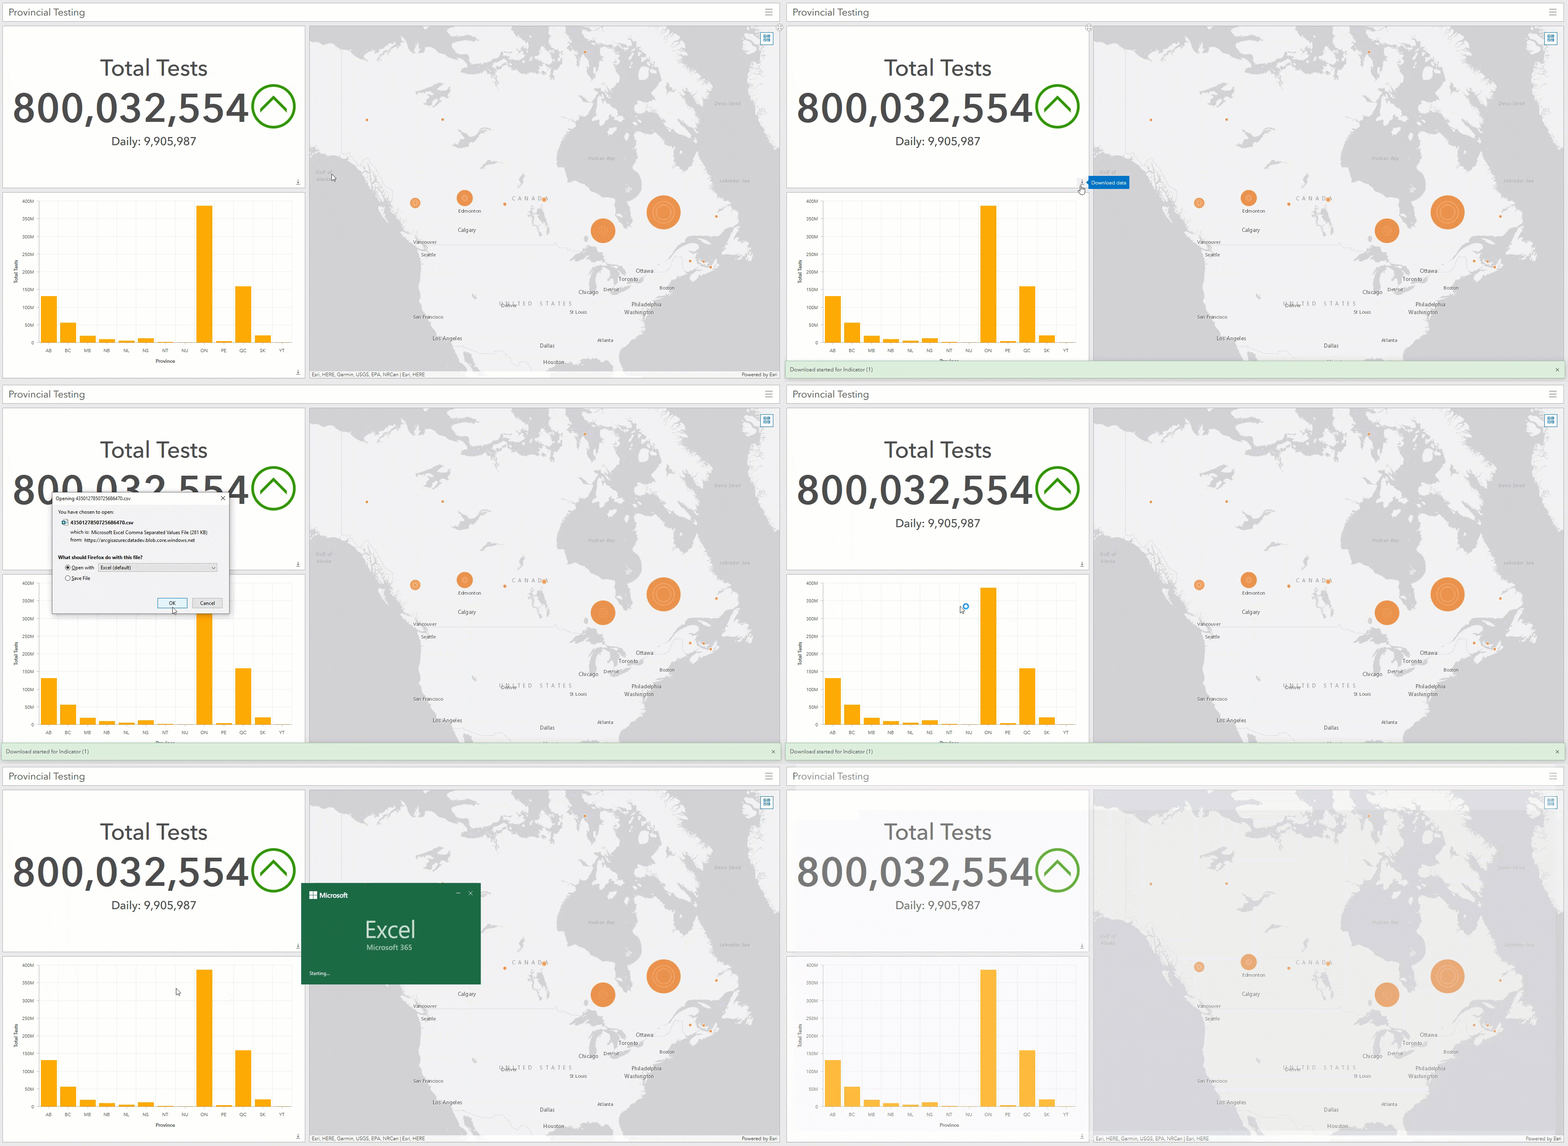
The September 2021 release of ArcGIS Dashboards includes some new and fun enhancements for you to make even better dashboards. Along with performance improvements to make your dashboards work better, we have also added the ability to download data from dashboard elements.
Data download
As dashboard authors, we build dashboards to present and visualize data for viewers. Now, we can go even further by allowing dashboard viewers to also download the data powering the visualization. When a viewer chooses to download data, a CSV file is downloaded that includes the fields from the layer and their values. Downloading an element’s data can allow you to explore, analyze, and share it as needed.

For most elements, what’s downloaded is the source data used to power the element – respecting all filters applied to both the data source and the element. Additionally, for elements that support categorized summary statistics, such as serial and pie charts, viewers also have the option to download the summarized data.
Learn more about data download.
Performance updates
The way that map extent filters are processed has been updated to better scale public dashboards that experience high amounts of traffic. Publicly shared dashboards now process extent-based filters using features that have already been downloaded to the browser from the map element. This means that as more users are simultaneously panning and zooming around on the map to filter other elements, your dashboard will continue to perform smoothly.
To make the most of map extent filters, make sure that the target elements have their data source based on a map’s operational layer.
Learn more about map extent filters on public dashboards.
Summary
These latest enhancements are all now available in ArcGIS Dashboards. Create your first dashboard or open your existing dashboards to start using these new enhancements! As always, we love seeing the dashboards you make. Share them with us on Twitter and LinkedIn using #ArcGISDashboards.


Article Discussion: