Many new features are introduced in this release of ArcGIS Experience Builder, including four widgets—Chart, Query, Coordinate Conversion, and Branch Version Management. In addition, the communication between widgets has been elevated to a new level with key components like data action to export the results to CSV or view results in a table, and the usage of output data dynamically generated from other widgets. Other highly anticipated features are support for attribute editing in the Table widget and passing URL parameters to embedded apps. Let’s dive into these new features.
Chart
Charts are a way to visualize data with patterns and trends. You can create charts from feature layers, scene layers, feature tables, and output data generated from other widgets (see the Output data generated from widgets section). Through actions, you can have charts interact with other widgets like Map, List, Table, etc. For example, you can flash crime cases happening at specific locations like residential areas on the map or understand where the most crimes happen in a designated area on the map.

The next example helps you understand what buildings are used for along the drawing line on the scene and how many there are. Keep in mind that only 3D Object scene layers and Point scene layers with querying capabilities are currently supported in Experience Builder.

You may also export a chart to a CSV or JSON file or view the statistic information in the table dynamically. See the Data action section below.
The Chart widget works with or without maps. At this initial release, both bar and column type charts can be created. More are coming. Stay tuned.
Query
With the Query widget, you can find information by running queries based on attributes and spatial areas you are interested in. For example, you may want to discover information for certain crime locations in the area where you live.

A new Records Created trigger and a new Show on map action have been added so you can automatically display the query results on the map.

Like Filter, you have a few arrangement options. The horizontal style below pops a window out to run the query task. You can move around and resize the window.

You can also export the query result to a CSV, JSON, or GeoJSON file, or view the result in the table dynamically. See the Data action section below.
Coordinate Conversion
As first responders, you may work across various apps that use different coordinate systems to pinpoint places. For example, one app might use decimal degrees (DD) and another app might require the same location to be specified in Military Grid Reference System (MGRS). The Coordinate Conversion widget helps you convert coordinates or addresses to other coordinate systems.

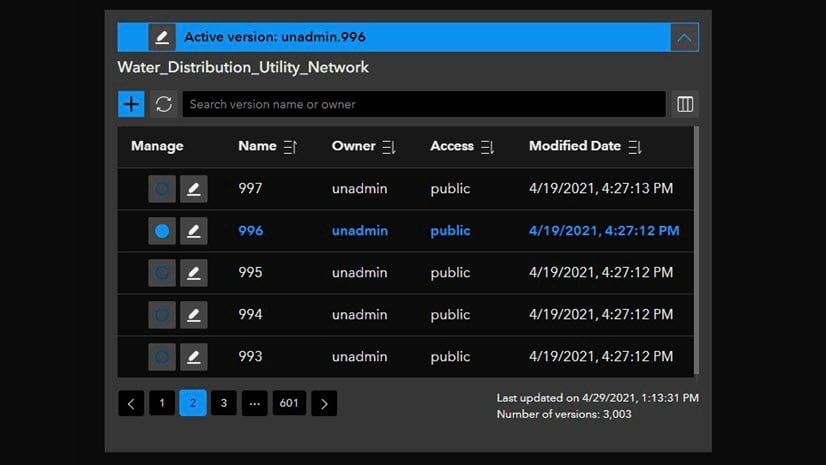
Branch Version Management
The Branch Version Management widget allows end users to manage the versions of branch versioned datasets. It provides the ability to switch versions, view and edit version information, and choose from different management capabilities such as create, assign, and delete versions. Note that changes made in this widget affect data across your app, so other widgets that use the same services display corresponding versions.
Although this widget currently only supports branch versioned services hosted in ArcGIS Enterprise, you can add a service as a data source by providing the service REST endpoint (URL) directly in the builder. You can also add an item to your ArcGIS organization that references the service and use the item from your organization when adding data to your app.

The widget comes with two arrangement options – Basic and Advanced. Use the former to simply switch versions as shown below. For more information, see the Manage Your Branch Versions with ArcGIS Experience Builder blog.

Keep in mind, all four new widgets can work with or without maps.
Data action
Data action is another way to make widgets talk to each other. Unlike Message action, which is pre-configured and triggered automatically at runtime, Data action enables end users to choose which action to take by clicking on it. For example, end users may view a query result in a table below, export selected records in a table to CSV, or zoom to features on the map, etc.

Choose your data actions under the Action tab, except for the Export action, which is configured in the Data panel and is on by default.

Output data generated from widgets
In addition to the data that you manually add to your app, some widgets like Chart and Query can dynamically generate new output data at runtime. This output data is in fact a feature layer that can be used in other widgets as a data source such as Text, List, Table, Feature Info, etc. The output is created as a new data source, so filters and selections on the output data won’t affect the original data source.

The following example demonstrates how Text and Chart widgets change their displays accordingly based on results from the Query widget.

For more information, see the Output data topic under Use data
Selected feature view
As you may know, a data source has various views—Default, Auto-populated, and Data view. A new Selected features view has been added. It is aimed to show features selected by the user at runtime. In the following example, items in the list change dynamically as the selection changes on the map.

Often when an app is opened, there is no selection from the user. You may prefer to show something other than no data though. To do so, check the View for empty selection option on the Data panel and click the Settings button to choose which features to show when there is no selection.

For more information, see the Data source views topic under Use data.
Enhancements
Table
Most of you have been asking for the ability to edit attributes in a table – you now have it.

As mentioned earlier, you can also export all or selected records to a CSV, JSON, or GeoJSON file from a table.

Embed
The ability to pass URL parameters from a web experience to an embedded app has been in high demand during the pandemic, as many Covid-19 related dashboards are embedded in Experience Builder for mobile optimization. With this release, an embedded app can obtain URL parameters that are added as a suffix to a web experience URL at runtime. As a result, you can use, for example, “state=” parameter URL in a single web experience to show the dashboard for each state in a country. The following screenshot illustrates the configuration of URL parameters in the Embed widget. To learn more, see pass URL parameters.

Window
You can now customize a window for different screen sizes.
Layout
One of the challenges when building an experience from a blank canvas is the positioning of elements on the canvas. Widgets can be challenging to snap and properly distance from one another so your layout looks the way you want. As such, snap lines have been added to assist you in aligning or accurately positioning widgets in the full screen app, Window, Fixed Panel, and Sidebar.

Template
Four dashboard style default templates have been added. Choose either a full screen or a scrolling dashboard template to get started.

For more information on all of these new features, see What’s new in Experience Builder.
Thank you,
The ArcGIS Experience Builder team


Article Discussion: