The new Map Viewer is the next generation map making tool for ArcGIS Online and ArcGIS Enterprise. First announced in October 2019, Map Viewer Beta was introduced a month later in ArcGIS Online and in July 2020 for ArcGIS Enterprise. With a new look and layout, the initial release immediately provided new ways to visualize data and build compelling web maps.
A lot has changed since then. For the Map Viewer specifically, the team has maintained an aggressive update schedule by adding new features and enhancements every month. In April 2021, the new Map Viewer was released in general availability. Here is a recap of the many great features included with the new Map Viewer.
Dot Density mapping style
The dot density drawing style is ideal for representing the count of something or someone with an individual dot. The dot density style works well in any situation where multiple counts or totals are in your data and when they share a common unit such as people, houses, incident reports, arrests, total dollars, etc.

Improved color ramps
The new Map Viewer provides hundreds of color ramps. Categorized by use-case, you can select ramps that have sequential color themes, ramps that best match light or dark basemaps, as well as colorblind-friendly ramps.

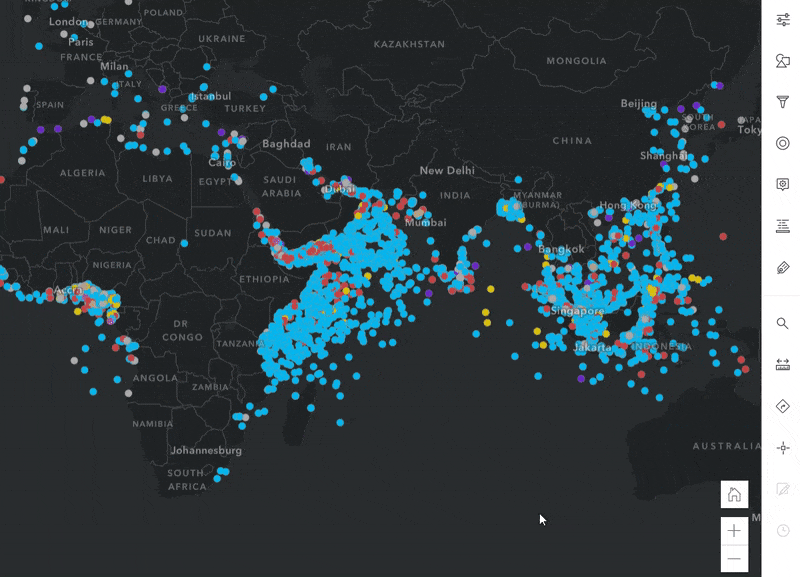
Clustering
Clustering offers an efficient way to visualize overlapping features by aggregating individual features into data-driven clusters that represent the feature count and the drawing style selected for the layer.
Check out Clustering is available in Map Viewer and Styling cluster labels and pop-ups for more details.
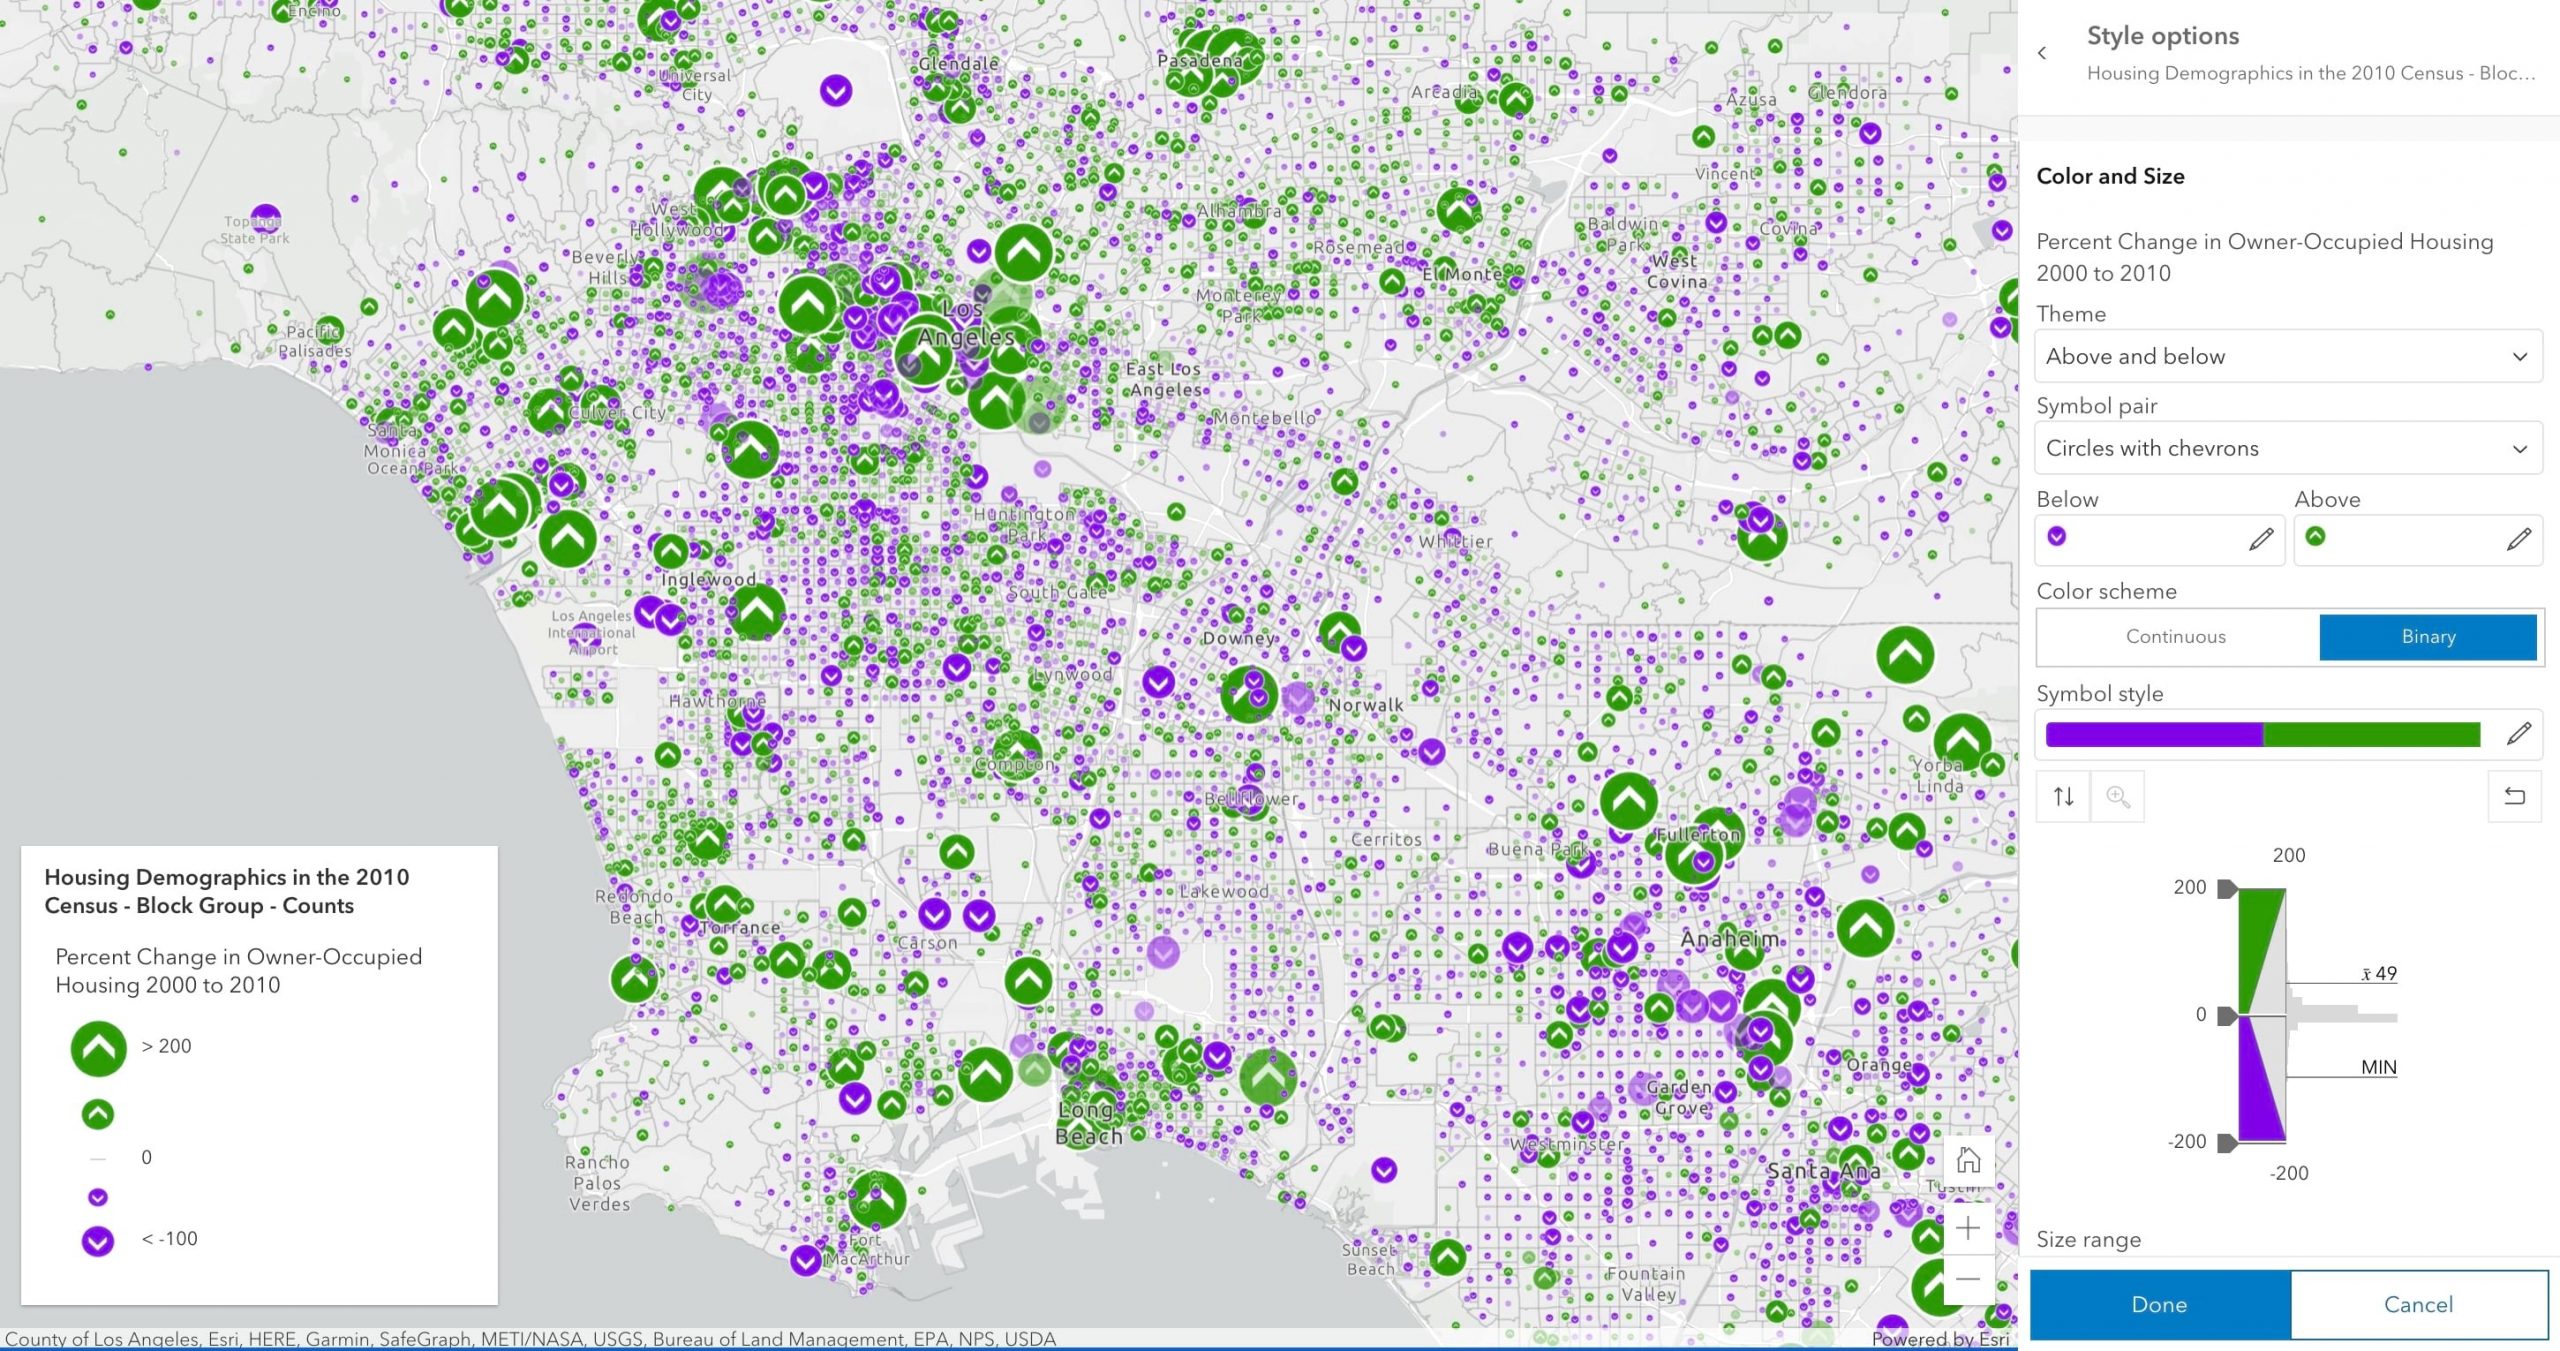
Mapping above and below
Highlight trends using divergent color ramps and symbol pairs designed to represent above and below values. Use both size and color to tell a powerful story with your data.
Auto size by scale
Point symbols, line widths, and polygon outlines automatically adjust when the scale changes. Optimal sizes are used as you zoom in and out, which helps maintain a consistent experience across all scales.
Blend modes
Blending takes two or more layers and “blends” the rendering for each layer, producing a new visualization for the layers depending on which mode is selected.
The blog articles Blend modes are here and they’re pretty awesome and Blend modes for thematic maps provide a great overview and excellent examples for using blend modes.

Labeling
Use multiple label classes, scale dependency, new fonts, and more to create labels that integrate seamlessly with your map.

Filtering
A dynamic filtering experience makes data exploration and configuring filters a simple and intuitive experience. Learn more about working with filters in Understand and explore your data in Map Viewer.

Pop-ups and field management
Show attachments in pop-ups. Build and rearrange pop-up content including images, attribute data, custom text, and charts to provide an engaging and informative experience with your map.

Check out the blog articles below for a dive into key pop-up features.
Working with layers
One of the big enhancements in the new Map Viewer is the ability to group layers. The layers in your map can be grouped together into a single layer where you can set transparency, define a visible range, and apply blend modes to the entire group of layers.
Also learn about adding layers and tables to your map, as well as accessing the attribute table for feature layers.
Enhanced bookmarks
Enhance bookmarks by adding a thumbnail generated from the map or by uploading your own custom image. If your map is rotated when creating a bookmark, the bookmark will use the rotation!

Basemap playground
Browse for basemaps from the ArcGIS Living Atlas of the World or use background color, blending and rotation to create your own customized basemap! Learn more with Basemaps in Map Viewer Beta: a new playground.
Preserve map scale
Map Viewer Beta includes the option to preserve the scale at which the map is saved. When map scale is preserved, you are ensuring the map is opened at the center point and scale for the map as when it was saved. If the map should instead open at the full extent, simply leave the Preserve map scale option disabled. For more information on preserving scale vs extent, check out Start Oriented: Setting your map view and rotation in Map Viewer Beta.
Note: the features mentioned are only a highlight of what the new Map Viewer offers. Explore all the blog articles on Map Viewer for a deeper dive into all the functionality offered. Each image in this article is excerpted from the corresponding blog articles linked for each topic.
More resources
- Gain a better understanding of web maps created in Map Viewer Beta versus web maps created in Map Viewer classic with web maps and Map Viewer Beta.
- Looking for Map Viewer Beta in ArcGIS Enterprise? Check out Map Viewer Beta in ArcGIS Enterprise 10.8.1


Article Discussion: