The first major updates for ArcGIS StoryMaps in 2021 have arrived, and they are BIG! Several impactful features have been added this month, and we can’t wait for you to dive in and start using them. Read on for all the details…
Beta features update
The first news to share this month is we’re taking three big features out of beta: themes, map actions, and explorer tours.
As a reminder, beta features in ArcGIS StoryMaps are stable and supported, but they may have a limited set of capabilities. Once a feature gets to the point where we feel it has a critical mass of utility, we remove the beta label.
Theme enhancements
Themes are a great way to brand stories and make them reflect your organization’s identity or create a unique look for a story about a specific topic. Creating a theme lets you customize fonts, colors, and other visual elements. We’ve seen some wonderful examples of themed stories, such as the ones below, created by members of the storytelling community.
For more information about creating your own themes, see Tips on using the new ArcGIS StoryMaps theme builder and our tutorial, Add flavor to your stories with theme builder.

Since the initial release of theme builder in September 2020, we’ve added several font families, additional separator styles, and a new color picker that makes it easier to select the right colors for your theme. We’ve got a lot more planned for themes, and this month we’ve rolled out a number of new capabilities.
Approved themes
Over the last few months, the storytelling community has gotten familiar with how themes work and how to create them. Now, we’re excited to open up how themes can be shared to create a standard, branded look for your organization’s stories through the use of approved themes.
Approved themes can be used by anyone in your organization. They work in a way similar to how organizations can share a set of basemaps for their members to use. A group can be created with one or more themes that are approved for use. That group is then designated by an administrator to be the approved themes group for the organization, via the new Organization settings page, as shown below.
Once the approved themes group is configured by the administrator, authors will see the My Organization tab when browsing for themes in the story builder. Themes in the designated group will appear here and be available for anyone in the organization to use.
For a step-by-step guide and more tips on setting up approved themes for your organization, check out the Share themes in your organization section in our updated theme tutorial.
Choose theme fonts from Google Fonts
The available font options in theme builder have exploded through a new connection with the web font library Google Fonts. There are now more than 1,000 open source font families available through Google Fonts for you to use in story themes. Just select Add from Google Fonts from one of the dropdown menus in the Typography section to get started.
Having lots of choices can be great, but pouring through a thousand fonts can also be overwhelming if you’re not a typography nerd. We’ve filtered the list down to a much smaller subset of the most useful fonts that will work best for story themes. However, if you’d like to peruse all 1,000+ font families, toggle on Show all options. To explore in detail, visit the Google Fonts catalog for more ways to search, browse, filter, and preview all the available font families.
For more tips on using Google Fonts in your story themes, check out our updated theme tutorial and this helpful article from Allen Carroll about Making smart type choices for ArcGIS StoryMaps.
Link styles
Theme builder has new hyperlink styles to further customize the look of your stories. There’s the solid underline style, which has been the standard style in all themes until now, and two new styles: dotted underline and background fill.
The configuration experience and new styles can be seen in action below.
Map Tour
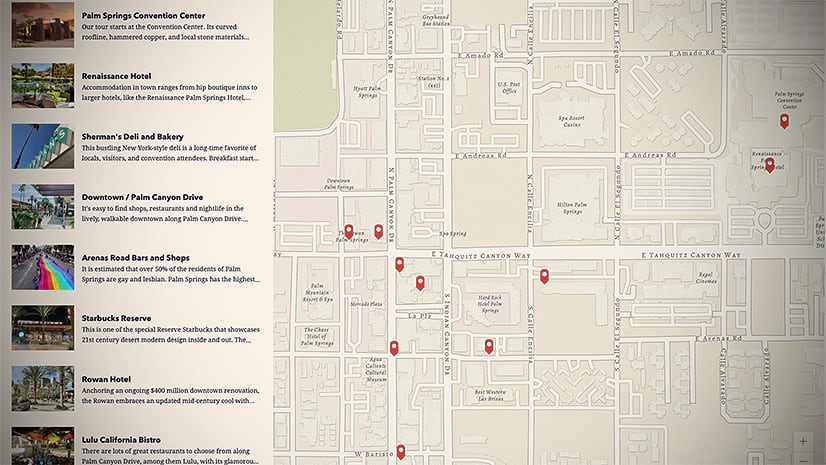
Map tours are an engaging way to present a set of places. There are two varieties: guided tour, which is best for smaller sets of places that you want to lead readers through sequentially, and explorer tour, which shines presenting larger sets of places.
Create a map tour from ArcGIS data
This month, we’ve introduced an exciting new way to create map tours…by connecting to an ArcGIS feature service. We refer to the results of this workflow as a “data-driven tour” since the tour place locations, titles, descriptions, and media come directly from ArcGIS data.
This method of creating tours provides an engaging new way to share—within the context of a story—information collected through ArcGIS apps like Survey123, Quick Capture, Field Maps, or the GeoForm template. Connecting to ArcGIS data is simply another choice you have when adding a tour to your story. Just select a feature layer (or feature layer view) with points, and you’ve got yourself a tour!
Once the tour is generated, you can use the tour options (the gear in the bottom bar) to make changes to the data fields used for the place titles and descriptions as well as update the sorting and filtering of places. You can also use any of the guided tour or explorer tour layouts (just choose Change layout from the … button in the configuration bar at the bottom of the screen).
You can take this new feature for a spin in our data-driven tour tutorial (say that five times fast!).
For data-driven tours, you won’t see options for editing the place information in the story builder like you do for tours created from scratch or by uploading photos. This is because the place information is coming from the data source. The tour data is configurable in the story builder but not editable. If you need to edit your place data, just use use any ArcGIS app that allows you to edit a feature service (like the Map Viewer).
Since you are making a tour as part of a story, the tour is limited to 100 places. If you’re looking for a way to browse a feature service with more features, check out the Attachment Viewer app template.
Explorer tour updates
There are now three sizes to choose from for the explorer tour panel. Similar to the size options already available for docked panel sidecars, the two new, wider panel width options let you devote more space to your tour place media and descriptions. Also, the explorer tour map symbol has been improved so it looks better on most basemaps, especially when there are several overlapping tour locations. These improvements can be seen in the video and image below.

Image gallery
Another request we often hear is for the ability to place two or three images side-by-side in a story. The story builder’s new image gallery block fills that need…and a whole lot more!
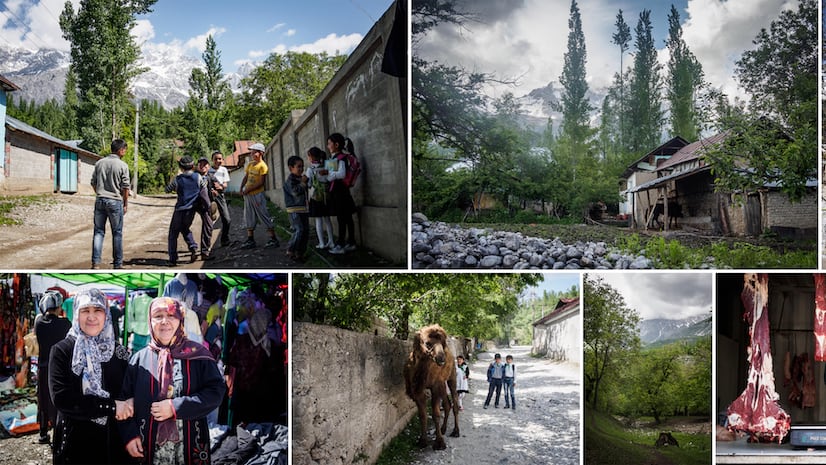
You can upload up to 12 photos to place in a gallery. The story builder arranges the images in an attractive collage and offers two engaging layouts for you to choose from: jigsaw and dynamic squares. Galleries make a set of photos look great, even if they have different sizes and aspect ratios.
The jigsaw layout resizes your images to fit them together but does not crop them. Below is an example from this story about Kyrgyzstan. This story also has several galleries with only two or three images, so be sure to check it out to see how effective a gallery can be at helping you present small sets of photos.

Choosing dynamic squares gives a different look where images are resized and cropped into tidy, even squares. Depending on the number of images in the gallery, the squares may all be the same size, or one row of the gallery may be larger to preserve an even, rectangular shape for the entire block. You can control the cropping for each photo by adjusting its focal point and also add attribution and alternative text; just hover over an image to access its options. Below is a square gallery of spider photos from Unsplash.

The video below shows how easy it is to add and configure an image gallery in your own story, and you can get more tips for using galleries to liven up your stories in our article, Visual storytelling: Bring your narrative to life with an effective mix of photos.
And more…
- The new color picker, which was added to theme builder and map designer in a previous update, is now available for text formatting.
- For inline images, authors can disable readers’ ability to click an individual image to expand it. This can be useful for decorative images, logos, small images, or any image that does not need to be viewed in a large format.
- A thumbnail image is automatically generated and stored with all uploaded videos. The thumbnail image is shown initially for videos that are set to click-to-play, or if the video cannot be loaded. You can upload your own thumbnail in the video options, if desired.
- We’ve taken time to improve some visual elements of the builder and make several stability and performance improvements.
Review our previous posts on the ArcGIS StoryMaps blog for summaries of the main features that have been added in previous updates, or visit the release notes for detailed information.
Banner image photo by Dannie Jing on Unsplash


Article Discussion: