ArcGIS Insights 3.4 is now available, and we are happy to share the new capabilities delivered with it! This release is packed with features valuable for your analytic understanding and sharing of information products. Some of the highlights include new chart types, analysis improvements, and data management enhancements. A complete list with more details is available within the help documentation. Let’s dive into some specifics…
Stacked percent bar chart
Stacked column and stacked bar charts now have a stacked percent layout option. This allows you to make proportional comparisons between categories. Let’s say that you want to understand which products are performing best within each sales territory. The percentage option allows you to comparatively understand which products are selling best.
In the below example, the percentage of each insurance type (life, auto, etc.) is shown within each regional territory.
 within each regional territory.")
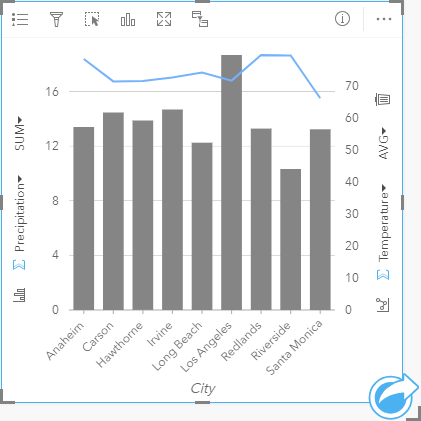
Combo chart
It’s now easy to create a combo chart. Use any dataset with 2 numeric (or ratio) fields and 1 string field. For example, a utility company may want to view planned consumption values vs. actual consumed values, in order to identify where some of the biggest differences are.
Below, we use a combo chart to track drought conditions in Southern California. To understand which cities are most vulnerable, we compare temperatures and precipitation in one chart.
Point Chart
Point charts allow you to understand how numeric values are distributed or summarized by a category. When more than one numeric field is used, interval bars (confidence intervals and error bars) can be added to show error distributions or be used to assess variance between variables. For example, if you wanted to better understand greenhouse gas emissions by country from 1990 to 2015, a point chart can be created to visualize yearly patterns in greenhouse gas emissions for the 10 highest average polluting countries.
The example below shows accident rate and casualty rates for local authorities in London and the surrounding region. The point chart allows you to easily visualize and compare these two important rates, and identify which local authorities have similar or different rates. Click the image to enlarge.

Regression Analysis improvements
Regression analysis is an extremely powerful way to model relationships, and make predictions. We’ve added more statistical outputs to ArcGIS Insights so you can be confident in whether your model is accurate or not. These new outputs (F statistic, t-value, p-values, and confidence intervals) allow you to more easily perform confirmatory analysis. This basically means that you can quickly understand how the model performs and if it is trustworthy. The process of creating a great regression model is repetitive and iterative. It’s easier to compare two model results against each other, run an additional model, and continue the comparisons until you’ve identified a solid model. During each comparison, you can see how the explanatory variables compare against each other, against the other model, and what predictors align with each variable.

Spatial aggregation
Spatial Aggregation calculates statistics in areas where an input layer overlaps a boundary layer. At this release, for line and area features, the aggregated values have been improved so that they are calculated using weighted values. The proportions of any lines or areas that fall within the input boundary determines the percentage of any values to be aggregated. Therefore, when summarizing areas, you should use fields with counts and amounts, rather than rates or ratios, so these proportional calculations make sense.
Link analysis improvements
Link analysis (also commonly called graph analysis) allows you to understand relationships and connections within your data. This can be either a link chart (non-spatial) or a link map (spatial). ArcGIS Insights now has improved link chart layouts and better use of space, for a cleaner layout appearance.
Within the below images, see the layouts before (top image) and after (bottom image) improvements. Click the image to enlarge.

Date and Time improvements
Change field type (within the data pane) has been extended to allow text strings to be converted to date/time fields. For example, data from a CSV file can be converted to date/time to create time series charts and to allow date difference calculations. Also, a new seconds component, or sub-field is now created when seconds data is available.

Copy data to workbook
Copy to workbook allows you to save data from different sources into your ArcGIS Insights workbook – including feature layers and database tables. This is valuable when you need to create relationships between datasets that live within different data stores, as well as other situations. It is also a valuable work-around for dealing with the limitations of remote datasets.
Insights Desktop in public preview
In the June release, we announced that ArcGIS Insights Desktop was available in a closed beta. It’s now out of closed beta and available to everyone within public preview. Anyone can download and install Insights Desktop. Once installed, activate it by logging in with any ArcGIS Online or ArcGIS Enterprise named user that has an Insights license assigned.
During this preview period, Insights Desktop supports built-in authentication for ArcGIS Enterprise, as well as ArcGIS Online. ArcGIS Enterprise web-tier authentication (active directory, SAML, PKI, IWA, LDAP) is not supported during public preview, but will in the final release in January.
Please note: The ArcGIS Insights Desktop beta program (through the Esri early adopter community) has now ended. If you previously downloaded the beta version software, any content created within that version is not re-usable within this public preview release. Content created in this public preview will be usable and supported within future releases.
Python & R improvements
Scripting in Insights is now out of beta. With this release, easily work with your code by using Select all or Clear Selection and adding an existing script to ArcGIS Insights using the Add to Model button. Once a script is added, you have options to work with it directly – Run, Open, Share, Download or Remove. When the script is run, it will create an ArcGIS Insights card visualization (presuming that a chart part of your script output). If a dataset is required as an input to the script, it opens a popup to select a dataset. If you choose to download the script, it is then available to you as a Jupyter Notebook file for use in other scripting environments.
Click the image to enlarge.

…and more!
Check out the new example gallery. This gallery has publicly-shared ArcGIS Insights pages and workbooks from many industries. Poke around and have fun playing with these examples from other organizations. Learn from what others have done.
You may have noticed a change to the ArcGIS Insights product name. The product is now referred to as ArcGIS Insights, instead of Insights for ArcGIS. This new name makes the product consistent with other ArcGIS apps available with the platform.
For even more detail on what’s new with Insights 3.4, check out the help documentation.
Please note: if your organization has deployed ArcGIS Insights in ArcGIS Enterprise 10.7 or 10.7.1, be sure to install Insights 3.4.1. If you are running ArcGIS Enterprise 10.6.1, download Insights 3.4. If you’re working with ArcGIS Online, just log in now to check it out!
What are you waiting for? Give these new capabilities a try, log in to ArcGIS Insights. Don’t have ArcGIS Insights yet? Sign up for a 21-day free trial today.


Commenting is not enabled for this article.