Part of the Esri Geospatial Cloud, ArcGIS Online enables you to connect people, locations, and data using interactive maps. Work with smart, data-driven styles and intuitive analysis tools that deliver location intelligence.
Use ArcGIS Online as a standalone solution for your mapping and analytics needs. Or, because it’s an integral part of the ArcGIS system, you can use ArcGIS Online to extend the capabilities of ArcGIS Desktop, ArcGIS Enterprise, or build custom apps using ArcGIS Web APIs and SDKs. ArcGIS Online also provides access to the ArcGIS Living Atlas of the World, a vast collection of curated, authoritative, ready-to-use content from Esri and the global GIS user community.
Don’t have an ArcGIS account? See Create an ArcGIS Account.
June 2019 release
ArcGIS Online is updated regularly, and this latest release adds many useful new features and enhancements. This update introduces improved member management capabilities, new configurable apps, new and updated Living Atlas content, and lots more. For additional details see the What’s new help topic or view all posts related to this release.
Mapping and visualization
Map Viewer is the built-in app that provides a way for you to create and interact with online maps. Add layers, change symbols, save, and share your work with others in configurable apps, app builders, or Story Maps. This release introduces the following new features and capabilities.
Customize vector tile layers
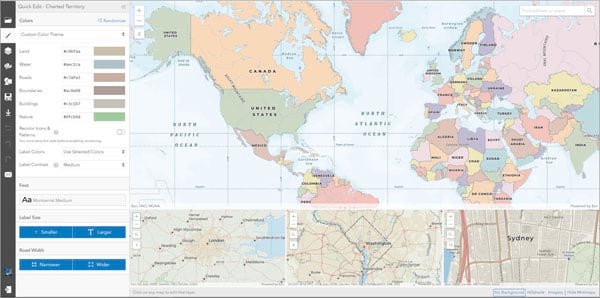
Vector tiles enable dynamic cartography and provide the flexibility to create your own layer or basemap styles. Vector tile layers retain the underlying data on the server, and the rendering is applied client-side via a style file. By creating your own style, the same data can be rendered in a variety of different ways, as shown below in this comparison of Esri vector tile basemaps. You can view other examples in the Creative Vector Tile Layers group.

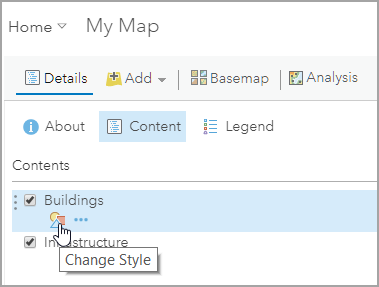
You can now customize the style of vector tile layers, including those in basemaps, directly in Map Viewer. Hover over any vector tile layer and click Change Style to open the Vector Tile Style Editor.
The Vector Tile Style Editor app can be opened directly from its ArcGIS Online item page. Use the Vector Tile Style Editor to choose from a gallery of Esri vector tile basemaps and layers to create your own basemap style.
Vector basemaps enabled by default
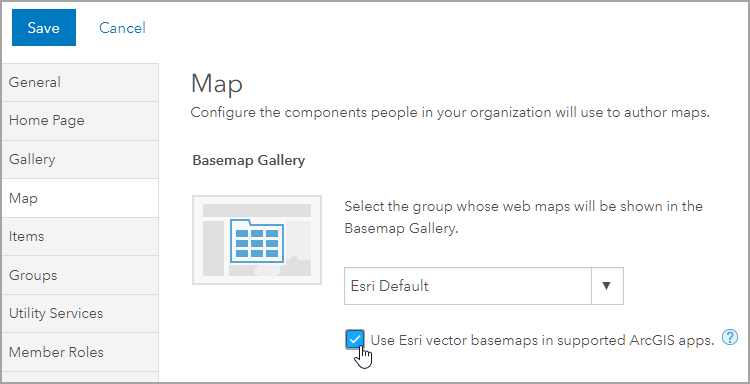
Esri vector basemaps are now enabled by default for new ArcGIS organizations. Existing organization administrators can set Esri vector basemaps as the default for their organization by opening the Map tab in the organization settings, and checking the box to Use Esri vector basemaps.
Vector tile basemaps are also available for anonymous users viewing your maps, as well as for users with public accounts.
New symbols
Map Viewer has three new symbol sets supporting the utilities community: Water, Sewer, and Stormwater.
Administration
Administrators can now simplify the member invitation process by configuring new member defaults such as user type, role, add-on licenses, allocated credits, and other member properties. The defaults you specify are automatically assigned to new members when you add or invite them to join the organization.
New filters and a consolidated search on the Members tab of the organization page make it easier for administrators to perform bulk member management tasks such as updating user types and assigning add-on licenses.
Two new options are now available for default administrators creating new groups in the organization. You can protect the privacy of members of public groups—for example, crowd-sourcing or community groups—by hiding the list of group members on the Members tab of the group page. You can also restrict members from leaving the group, which ensures that members remain in the group unless they are removed by the group owner or a group manager.
A new set of administrative privileges can be assigned through custom roles that allow members to administer web site or security settings without having to be default administrators.
For organizations participating in a distributed collaboration, a new Collaboration filter makes it easier for administrators to find collaborated content.
Common administrative workflows such as assigning licenses and inviting members are now optimized for smaller screens.
Other improvements
This release also introduces the following changes and improvements.
When configuring a locator view of the ArcGIS World Geocoding Service, you can now specify a preference for displaying locations either on rooftops or parcel centroids or on the side of the street.
You can now perform analysis on time enabled feature layers.
When preparing web maps for offline use, you can now draw a polygon to define the area of data included in the map when users take it offline. This provides you with more control over what data is taken offline.
You can now rebuild only the parts of a 3D object hosted scene layer’s cache that changed as a result of edits made to its associated feature layer. This allows you to keep the scene layer and feature layer in sync without having to rebuild the entire scene cache.
You can now share items with a group you own or manage directly from the group page.
ArcGIS Online has an improved experience for inviting large numbers of users to groups.
Configurable apps
Configurable apps are template applications that you can configure easily, without any coding. They help you publish apps quickly for a variety of users and workflows. Configurable apps are the fastest and easiest way to go from a map to a shareable app. New for this release:
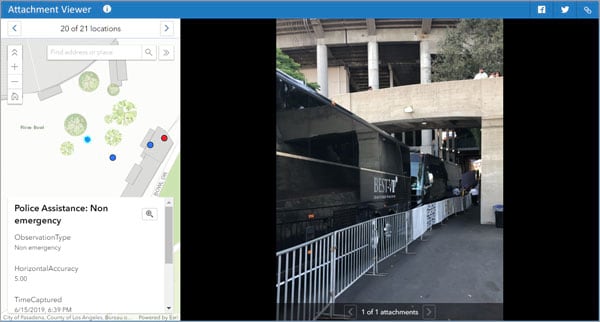
Attachment Viewer allows you to provide an immersive experience for viewing feature layer attachments. The app is especially useful for viewing attachments on layers created by Collector for ArcGIS, Survey123, QuickCapture, and more.
Zone Lookup locates boundaries, zones, or districts which intersect a specific location or address. Users of this app can learn more about a location and features of interest in the surrounding area.
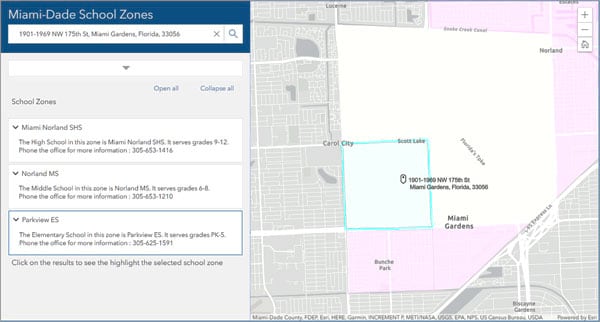
Both Attachment Viewer and Zone Lookup are optimized for use on both desktop and mobile browsers.
Other updates
Interactive Legend now supports the Relationship and Location (Single Symbol) drawing styles. In addition, the app includes options to update the map extent based on the filtered features and include a feature count for each category in the legend.
Living Atlas
ArcGIS Living Atlas of the World is the foremost collection of geographic information from around the globe. It includes curated maps, apps, and data layers from Esri and the global GIS user community that support your work. Visit the ArcGIS Living Atlas of the World website where you can browse content, view the blog, and learn how you can contribute. Here’s what’s been recently released, new at this release, or coming soon.
The World Imagery basemap has been updated with the latest DigitalGlobe EarthWatch Vivid and Metro imagery. Small-scale extents now have the latest Earthstar Geographics TerraColor imagery.
World elevation layers, including terrain and bathymetry, have been updated with high resolution data. For details see High resolution data updates to Living Atlas World Elevation Layers (June 2019).
Demographic maps for several countries have been updated. United States demographics now includes 2019/2024 data. For more information, see What’s new in Esri Demographics.
Popular environmental content has been updated, including the National Land Cover Database, USA Cropland, and SSURGO soil data. For more information see:
- Time-Enabled Croplands Reveal the Rhythms of American Agriculture
- Mapping Two Decades of Landcover Change in the U.S.
World Hillshade (Dark) provides a dark hillshade that is especially useful as a backdrop when terrain context is desired, and you want other layers to stand out. For more information, see Introducing Dark Hillshade.

Vector basemaps
Navigation (Dark Mode) is designed to complement existing navigation style maps with a custom ‘dark mode’ navigation map style that is designed for use on mobile devices in low-light or night conditions.

Community Map provides a customized world basemap that is uniquely symbolized. It is optimized to display special areas of interest (AOIs) that have been created and edited by Community Maps contributors. These special areas of interest include landscaping features such as grass, trees, and rock and sports amenities like tennis courts, football and baseball field lines, and more. Take a tour of Community Map additions.

National Geographic Style reflects the distinctive National Geographic cartographic style in a reference map of the world. It also leverages content from the Global Ecological Land Units map, adding an ecosystem-based context for the planet.

OpenStreetMap Vector Basemap is updated every few weeks with the latest OSM data. It’s freely available to any user or developer. OpenStreetMap Vector Basemap introduces two new map styles. OpenStreetMap (Esri Street style) is rendered using a cartographic style similar to the World Street Map style. OpenStreetMap (Esri Imagery Hybrid style) uses a style similar to the Esri Vector Basemap Imagery Hybrid style, with imagery set to 25% transparency to better display the reference layer. See these styles in the OpenStreetMap group.
Watercolour creates a unique and “artsy” look by applying a style of hand-painted watercolors.

Other
Several live feeds are now published as hosted feature layers which are publicly available to anyone, furthering Esri’s commitment to supporting emergency management and disaster preparedness around the world. These new services will also update automatically in maps and apps, delivering the latest critical information. The first set of live feeds will focus on weather, additional live feeds will be released as hosted feature layers throughout the year.
The Community Maps Editor app now allows you to edit commercial points of interest for basemaps. The app is no longer in beta. You can now submit your dashboards created with Operations Dashboard for inclusion in the Living Atlas.
For the latest information, see the Living Atlas blog articles.
Esri Maps for Public Policy
Powered by the Living Atlas, Esri Maps for Public Policy is a free resource for policy makers to actively engage in community decision making. Communities now have access to ready-to-use maps from curated datasets that help you learn more about social equity and health, economic opportunity, transportation and infrastructure, resilience and sustainability, environment and natural resources, and public safety.
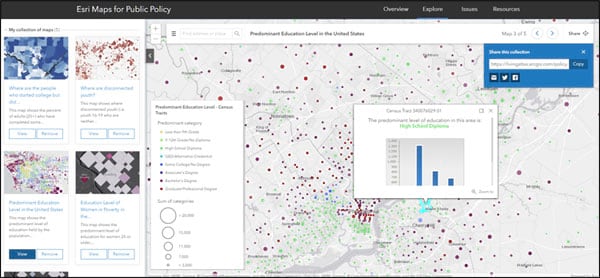
Browse existing map collections, and make your own collections to share with others and make your point. View 7 Tips for Effective Policy Maps to help make your maps more impactful and clear.
Visualize how the population has moved throughout the United States from 2015 to 2016 with a new set of maps showing population flow from state to state, and county to county.
County Health Rankings 2019, a collaboration between the Robert Wood Johnson Foundation and the University of Wisconsin Population Health Institute, measure the health of nearly all counties in the nation and rank them within states.
View the excellent policy apps and maps from the Trust for Public Land. Its ParkServe® and ParkScore® apps and maps are now available in the Living Atlas and Esri Maps for Public Policy sites.
StoryMaps
Harness the power of maps to explore locations, events, and trends that matter. Story Maps bring text, photos, and videos together with maps to help you create a narrative that informs and inspires. Whatever your message may be, whoever your audience is, everything you need to create remarkable stories with maps is here—all in one place.
Releasing in July, ArcGIS StoryMaps is the next generation of Esri Story Maps, and builds on the capabilities of the classic story map templates and adds a number of new features. For authors, StoryMaps has a single builder for assembling any type of story from content blocks such as narrative text, multimedia, maps, and embedded web content.
Authors can create express maps with new simple, map making tools, or add existing maps and scenes from ArcGIS Online or their organizations.
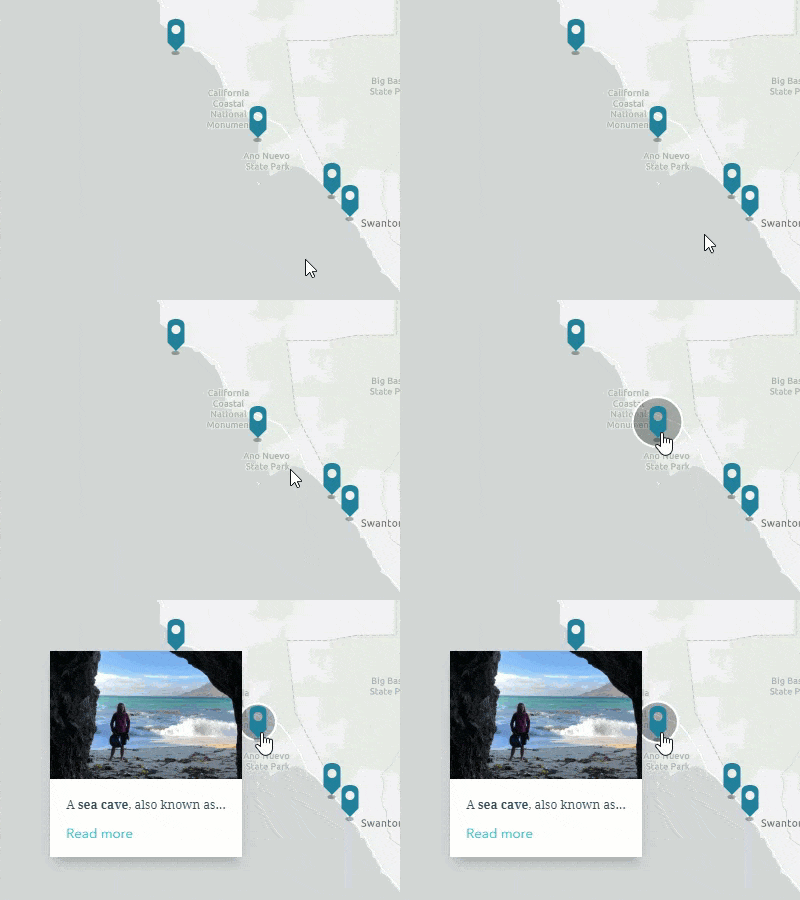
Story themes and the publishing process have also been improved to support common workflows. Story viewers can read stories on any device, share social links, and embed stories in their own web pages. For more information, see the ArcGIS StoryMaps FAQ.
Insights for ArcGIS
Insights for ArcGIS extends GIS to your entire organization, empowering analysts to perform location analytics through a familiar user experience. Users can directly connect to enterprise business data as well as ArcGIS, to perform drag-and-drop spatial analysis.
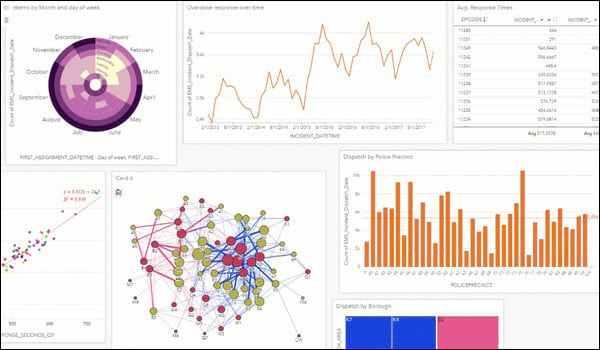
Highlights for this release include the following:
Pie and column charts can be placed directly within the map. These pie and column charts are interactive, and can drive other card selections and filters.
Summary tables are a powerful way to quickly communicate tabular information, and limits to the number of fields within the summary table have been removed.
Percentile statistics are now configurable, so that you can understand the distribution of data and outliers. Percentile is available within the summary table, bar chart, column chart, and line graph.
Insights Local on Windows and Mac is a new way work with Insights as a native application, and is available in beta to anyone with an existing Insights license. Insights Local looks and feels the same as the browser version, but adds unique features such as working offline, leveraging local CPU for analytics, and connecting directly to enterprise business databases. All administrators of organizations that license Insights will be emailed beta access instructions for their users.
For more information, see the What’s new in Insights help topic. To begin learning, see Get Started with Insights for ArcGIS.
App builders
App builders let you easily create custom apps, no coding required. App builders have been updated with the following enhancements:
AppStudio for ArcGIS
AppStudio for ArcGIS lets you turn your maps into beautiful, consumer-friendly mobile apps ready for Android, iOS, Windows, Mac OS X, and Linux. Your branded apps can be published to all popular app stores – no developer skills required. With AppStudio, organizations on the ArcGIS platform now have the ability to build cross-platform native apps easily.
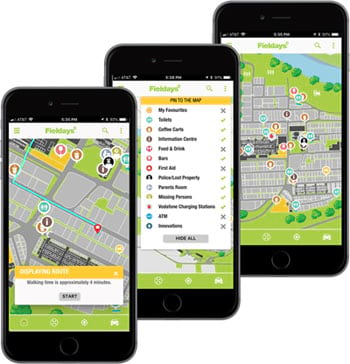
The build environment of AppStudio has been upgraded to use XCode 10.1 to ensure that you can continue to upload your apps to the Apple App Store successfully. AppStudio now also supports Enterprise Mobile Management (EMM) software to read and overwrite some default settings for iOS and Android devices. This allows you to manage and secure your apps and data across mobile devices. For more information, see Whats new in AppStudio for ArcGIS.
AppStudio for ArcGIS 4.0 Beta is now available on the Early Adopter Community. AppStudio 4.0 allows users to choose between Qt Creator and Visual Studio Code as the default editor for their apps. Support has also been added for changing languages while running your app. Player now recognizes the language files included within apps and displays apps in the language selected on the device. For more information see Introducing AppStudio for ArcGIS 4.0 Beta.
For more information on what’s new with AppStudio for ArcGIS 4.0, see the AppStudio for ArcGIS 4.0 Beta release blog.
Web AppBuilder for ArcGIS
Web AppBuilder for ArcGIS offers a way for you to easily create web apps that run on any device, using a gallery of ready-to-use-widgets. You can customize the look of your apps with configurable themes and can host your apps online or on your own server.
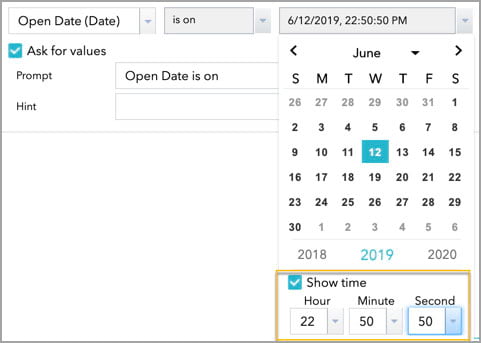
Web AppBuilder for ArcGIS adds a new Business Analyst widget to provide a way to generate Business Analyst Infographics and Classic Reports. You can now add stops in Directions by searching feature layers. Query and Filter have been updated so you can perform a query on a combination of date and time, including hours, minutes and seconds.
The My Location widget has new options to display compass orientation and location accuracy on a mobile device. In addition, more widgets and themes have been enhanced for accessibility. For more information, see What’s new in Web AppBuilder for ArcGIS.
Apps for the field
ArcGIS apps for the field help you use the power of location to improve coordination and achieve operational efficiencies in field workforce activities.
ArcGIS QuickCapture
ArcGIS QuickCapture is a new mobile application that allows you to capture field observations with the single tap of a button. QuickCapture is specifically designed to help you capture field observations fast. Its ‘big button’ user experience makes it ideal for at-speed data collection workflows, where field users must be able to capture information while travelling in a vehicle such as a car, helicopter, ATV, etc.
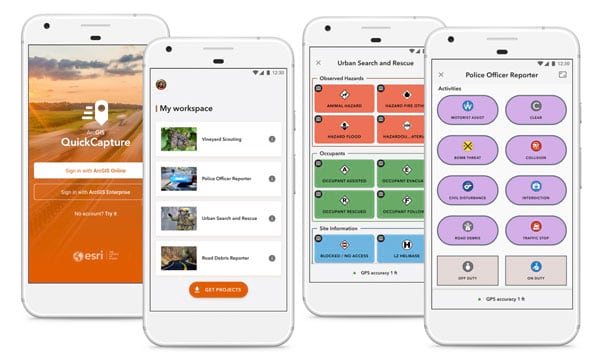
Use QuickCapture on your Android, iOS, or Windows device to support at-speed asset inventories, aerial surveys, rapid damage assessments, crop scouting, and quick field observations. The mobile app can be integrated with external GNSS receivers for higher location accuracy.
You can create QuickCapture projects through QuickCapture designer, a web-based experience where you can configure the look and feel, layout, and behavior of your QuickCapture interface. You can kick-start your projects on top of existing feature services from either ArcGIS Online or ArcGIS Enterprise.
To get started with ArcGIS QuickCapture, visit the QuickCapture website. For more information, see the QuickCapture help.
Tracker for ArcGIS
Know the real-time location of your most valued assets, your mobile workers. Tracker for ArcGIS is a mobile solution that enables organizations to capture the tracks of field staff, monitor where they are, and analyze where they have been. Tracker includes a mobile app for iOS and Android devices that efficiently runs in the background to capture location tracks, then feeds these tracks directly into a location tracking feature service, a new capability within ArcGIS.
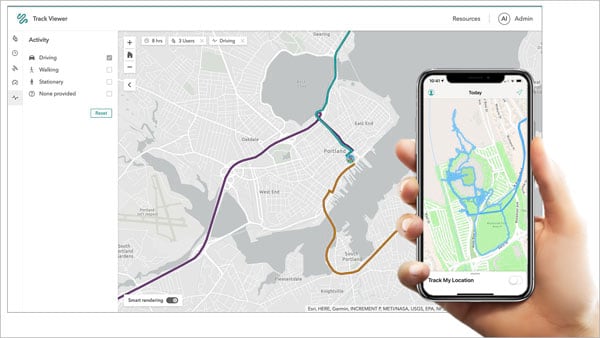
Location tracks can be viewed and interrogated by authorized viewers with the Track Viewer web app or other visualization and analysis tools in ArcGIS that leverage its location tracking capability. Track patterns give decision-makers real-time information to support critical field activities and perform analysis in ArcGIS.
Tracker for ArcGIS was recently released for ArcGIS Enterprise, with a beta starting in July for ArcGIS Online users. For more information see the Tracker for ArcGIS blog article or the Tracker for ArcGIS FAQ.
Collector for ArcGIS
Collector for ArcGIS enables the use of your smartphone or tablet to collect and update information in the field, whether connected or disconnected.
Collector for ArcGIS on iPad and iPhone have been updated. There is now parity with Collector Classic—you can use a referenced basemap when downloading a map to work offline, and if you have related features, you now choose if they can be captured directly or must be captured through their parent feature. A number of enhancements are also included. You can copy basemaps directly to your device with the Files app. Using Eos Tools Pro and Lasertech rangefinders, you can capture offset locations. Linking to the app has a new format and is more powerful, allowing you to provide additional information. Finally, some bugs you reported have been addressed. For more information see the Collector for ArcGIS What’s new help documentation, or the What’s New in Collector for ArcGIS blog article.
Explorer for ArcGIS
Take your maps with you everywhere you go with Explorer for ArcGIS, a mobile app for iOS and Android. Take your GIS with you in the field, work offline, and add shapes and notations directly to your map.
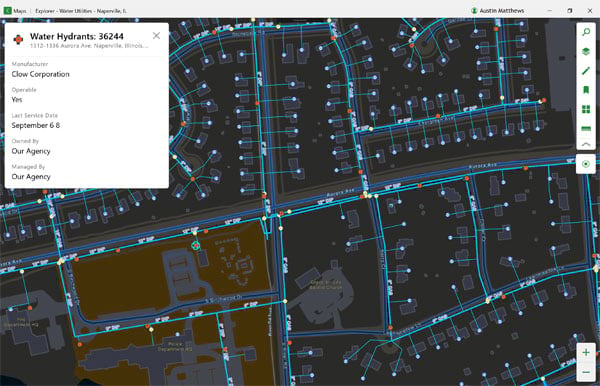
Offline map areas that have been created in ArcGIS Online for your web maps can now be used in Explorer for ArcGIS [beta]. Explorer is an easy-to-use map viewer app that lets you take your GIS assets (including attachments) and beautiful cartography into the field on your mobile device, regardless of whether you have connectivity or not. See where you are, take measurements in the field, make notes about what you find – now on your Windows 10 device. Find out how to download the latest beta and see the newest features by visiting the Explorer for ArcGIS Beta at theCommunity on GeoNet.
Survey123
Survey123 for ArcGIS is a simple and intuitive form-centric data gathering solution that makes creating, sharing, and analyzing surveys possible in just three easy steps.
Survey123 for ArcGIS has had two incremental releases since the previous ArcGIS Online update. Users can now trigger webhooks when a survey has been edited via the field app or web app.
In the Survey123 website, the feature report functionality is now officially supported, and the Data page supports viewing related tables. Usage information for feature reports is now provided. Feature report generation does not currently consume credits; credits will be charged in a future release of ArcGIS Online.
Surveys that are created and shared by others can be previewed and saved as a copy. Those using multiple accounts can switch accounts without signing out. In the web designer, users can control multiple submissions, the open and close status of a survey, and read-only properties of some question types.
The field app now supports creating watermarks on photos, a new grid theme layout and has a new improved inline validation of error messages. The user interfaces of Survey123 Connect and the field app have been updated, in addition to other improvements to the underlying repeat, relevant, required, constraint, and expression validation.
For more information, see What’s new in Survey123 for ArcGIS.
Navigator for ArcGIS
Navigator for ArcGIS is a professional mobile navigation app for Android and iOS that enables you to route your field workforce. It comes with hundreds of global maps or add your own custom map. Define travel modes, route on your own roads, and search your assets.
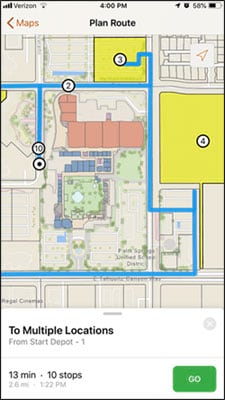
Use the Plan Routes tool to create a set of route layers that will determine how a fleet of vehicles can visit a set of stops in the least amount of time. Navigator for ArcGIS [beta] can now be used by your fleet drivers to get turn by turn voice guidance along these route layers using your Android or iOS mobile devices. Find out how to download the latest beta and see the newest features at the Navigator for ArcGIS Beta Community on GeoNet.
Apps for the office
ArcGIS Apps for the office enable operations managers and analysts to visualize data in a geographic context to gain location-based insights and make decisions that save money and time. Some apps for the office have been updated. Here are a few highlights.
ArcGIS Business Analyst Web
ArcGIS Business Analyst Web is a web-based solution that applies GIS technology to extensive demographic, consumer spending, and business data to deliver on-demand analysis, presentation-ready reports and maps. Select from a wide variety of existing reports, or create custom reports to meet your marketing needs.
ArcGIS Business Analyst Web App users now have access to updated 2019/2024 U.S. Demographics Online data, which includes historical data for U.S. population, housing, and housing units, and can easily add Business Analyst content such as infographics to ArcGIS StoryMaps.
A new Web Appbuilder widget enables the use of Infographics and Classic Reports in applications. Users can leverage dozens of starter infographics and report templates created by Esri, as well as any custom templates created by others in your organization. Also added is the ability to seamlessly use Business Analyst content in StoryMaps.
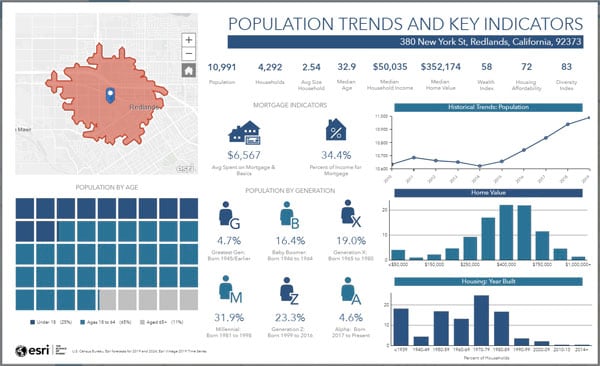
For more information, see the What’s new in ArcGIS Business Analyst Web App blog article and the Business Analyst What’s New help documentation.
ArcGIS Maps for Adobe Creative Cloud
ArcGIS Maps for Adobe Creative Cloud lets you access and design with data-driven maps inside Adobe Illustrator and Photoshop. Quickly find and add geographic content to your work as editable vector layers and high resolution images.
ArcGIS Maps for Adobe Creative Cloud now provides in-app purchasing for commercial-grade access: sign up for a Plus account, a low-cost monthly subscription plan that allows access to all premium maps and layers in ArcGIS Online. This update also introduces new enrichment tools, including the ability to create geographic offset, add demographic attributes to existing layers, and visualize travel times. For more information, see What’s new in ArcGIS Maps for Adobe Creative Cloud.
ArcGIS Maps for Power BI
ArcGIS Maps for Power BI helps you unlock the power of location in your business intelligence with ArcGIS Maps for Power BI, available inside Microsoft Power BI. Create map visualizations that surface patterns and trends in your data, gain context with ArcGIS maps and demographic data, and make better business decisions.
A forthcoming release (mid- to late-July) of ArcGIS Maps for Power BI will allow you to lock the map extent to a specific view to prevent the map from automatically zooming to a location while you work. The update will also include additional pin colors and improved field well tool tips. For more information, see What’s new in ArcGIS Maps for Power BI.
ArcGIS Maps for SharePoint
The latest release of ArcGIS Maps for SharePoint includes support for SharePoint 2019. ArcGIS Map Search now allows you to geotag documents using multiple attributes, geotag picture libraries, and quickly find geotagged features using the search field. The ArcGIS Maps Locate workflow supports IWA and PKI secured environments, and all app communications are now executed through HTTPS.
The improved, centralized configuration experience allows you to configure multiple site collections at once, and a new refresh token autorenewal feature ensures continued secure transactions when using ArcGIS Maps for SharePoint (this feature is available with ArcGIS Online and ArcGIS Enterprise10.6 and later). For more information, see What’s new in ArcGIS Maps for SharePoint.
3D GIS
New smart mapping styles in Scene Viewer provide complete styling capabilities for lines and polygons. You can now create attribute-driven 3D extrusions from building footprints and color them by usage type, for example. Additionally, new line profiles allow you to create visualizations with 3D tubes, squares, walls, and strips in your scene.
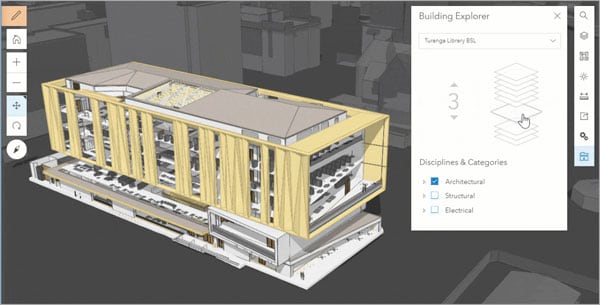
Isolate each level of a building interactively with the new floor picker in the Building Explorer tool. Explore and gain better insight into BIM buildings published from ArcGIS Pro, now with predefined filters that allow for custom views.
Add animated water visualizations to your scenes. Whether you’re looking at an ocean from far away or a lake close-up, the new Water polygon style allows you to create realistic views, such as naturalistic sunlight reflections off the water.
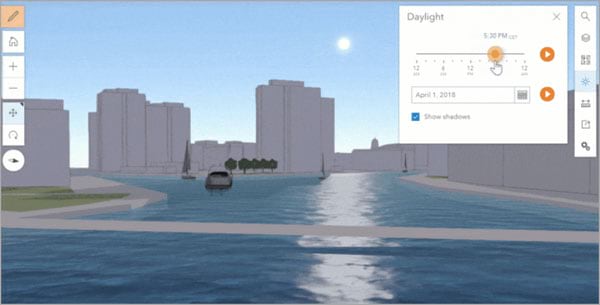
Scene layer performance has been improved. Scene Viewer loads integrated mesh, 3D objects, and buildings up to four times faster with the new I3S specification version 1.7. In addition, new client-side caching helps reduce areas without data when exploring the scene.
Miscellaneous
- The Esri-provided gallery in Scene Viewer added new 3D models, such as bicycles and fire hydrants, to further customize your scenes.
- Infrastructure and Recreation web styles are new in the gallery.
- Automatic level of detail has been added to 3D models of schematic trees to maintain strong performance in scenes.
- Scene Viewer now supports the CGCS 2000 coordinate system.
Fore more information see View scenes in Scene Viewer and Whats’ new in Scene Viewer (June 2019).
ArcGIS Hub
With sites, events, configurable apps, and other solutions, ArcGIS Hub enables your team to create and share initiatives that align collaborators across organizations and communities with the information and content they need to manage projects and drive desired outcomes.
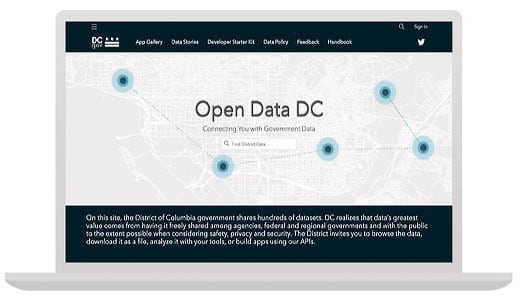
ArcGIS Hub continues to grow, shaping how you build sites, share content, and connect with your community. Recent enhancements include new global navigation and header options that are mobile responsive and easy for non-html users to configure. You can also now configure your hub to support SAML so that community members can sign in using your organization’s identity provider. These are just a few of the things we’ve been working on. For more information see What’s new in ArcGIS Hub.
ArcGIS Urban
ArcGIS Urban is a new web-based application that applies 3D GIS to urban planning. The application provides a visual overview of all the plans and projects in a city, with the ability to compare multiple design scenarios.
The overview promotes citizen engagement by allowing public users the option to add their own ideas. In addition, the app has design and editing functionality. Zoning rules are visualized by converting legal text into 3D forms with a footprint and maximum height. Plausible future building scenarios can be generated within the limitations of the zoning rules and the impact of design decisions can be analyzed using metrics generated automatically within the Urban Dashboard.
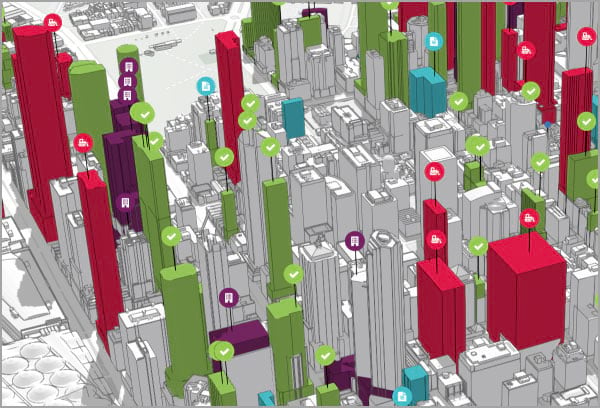
For more information, see the ArcGIS Urban product information.
ArcGIS Solutions
ArcGIS Solutions are free templates that configure ArcGIS to perform industry specific workflows. There are two new ArcGIS Solution templates that can be deployed into an ArcGIS Online organization.
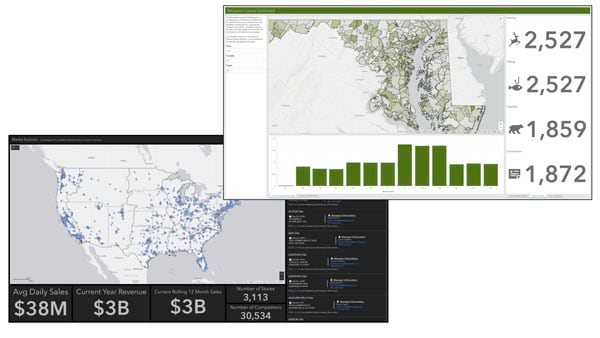
Recreation License Outreach deploys a pre-configured Operations Dashboard for ArcGIS app and ArcGIS Pro companion project that helps organizations analyze data to better target recreation license reactivation, retention and recruitment campaigns.
Market Development helps you deploy a pre-configured Operations Dashboard for ArcGIS app that helps retail organizations visualize and explore sales information on a map.
Learn ArcGIS
Learn ArcGIS is a website containing timely and engaging guided lessons that are based on real-world problems, covering the entire ArcGIS platform. Whether you are new to GIS, or are a seasoned analyst, Learn ArcGIS has resources to help you build your GIS skills. If you’re going to the User Conference this year in San Diego, make sure to stop by our booth locations in the Concourse across from the Esri Store, and in the Expo at the ArcGIS Online product island.
Learn ArcGIS will soon release several new lessons, on topics from adding features to your community’s basemap, to finding test markets for a new start-up, to calculating access to roads in rural Japan. For more how-to scenarios, check the Lesson Gallery. Most lessons require membership in an ArcGIS organization. And, if you don’t have ArcGIS yet, you can try it for 60 days by joining our ArcGIS Learn organization or sign up for a free ArcGIS trial.
ArcGIS Companion
ArcGIS Companion makes it easy to access your organization from your mobile device. In addition to the mobile browser option (just use your URL), you can now access your organization using this companion mobile app for iOS and Android. Access your organization anytime, anywhere, to explore content, view groups, edit your profile, and more.
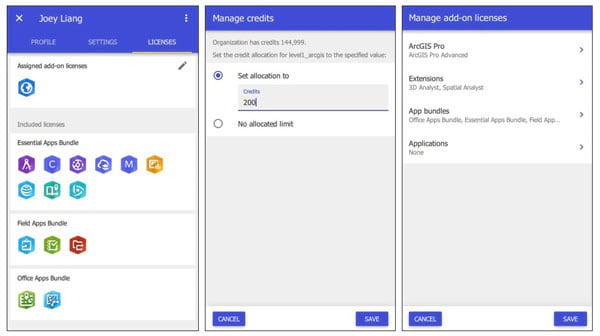
ArcGIS Companion has added more features and enhancements since the previous ArcGIS Online update. Highlights include managing add-on licenses for existing organization members and improvements to the member search. If your organization has credit budgeting enabled, administrators and custom roles with appropriate privileges can now manage an individual member’s credit allocation.
The Organization page also has a new filter to find members based on credits remaining. When adding members, temporary passwords must comply with ArcGIS Online’s more rigorous password requirements. Hindi and Ukrainian languages are now supported in the app. For more information, see What’s new in ArcGIS Companion.
For more information
For more information and additional details, see the What’s new help topic or view all postsrelated to this release.


Commenting is not enabled for this article.